

Open-source development library
Build observability around the data your application needs.
Collect and process Fast DDS topology, QoS, status and performance information through a C++ API designed for custom monitoring and analysis applications.
Domains, entities, relationships and QoS.
behavior
Latency, throughput and RTPS activity.
Queries, listeners and application logic.
OPEN SOURCE The foundation for a custom Fast DDS observability application.
Use the Apache 2.0 library directly when you need to control the interface, processing and integration around the collected data.
How it works
From Fast DDS measurements to application-ready information.
The Statistics Module publishes selected measurements over dedicated DDS topics. The backend receives them, maintains the system model and exposes a focused API to your application.
Enable the measurements
Select the statistics DataWriters your Fast DDS participants should publish through configuration, XML or the environment.
Monitor the environment
Start a monitor for a DDS domain or Discovery Server network and let the backend collect entities, status and statistics data.
Query or react
Build the required interface using topology queries, statistical series, status information and listener callbacks.
Core capabilities
A data layer for purpose-built DDS observability.
Keep DDS monitoring mechanics in the backend while your application focuses on the workflow and experience it must provide.
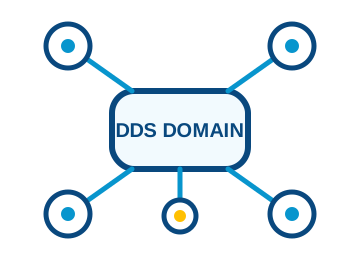
Reconstruct the system behind the traffic.
Retrieve a graph of domains, participants, topics, readers, writers and their relationships, together with the physical and DDS metadata your application needs.
- Domain-view graph
- Entity and physical metadata
- QoS and type information
Turn raw measurements into useful series.
Query latency, throughput, traffic and protocol behavior over a selected interval. Divide it into bins and apply the statistic needed by your interface or analysis.
- Flexible time windows
- Raw points or binned series
- Mean, median, minimum and maximum
Expose the conditions that explain behavior.
Check whether entities remain active and retrieve status data such as incompatible QoS, liveliness changes, missed deadlines and lost samples.
- Active and inactive state
- QoS incompatibility status
- Liveliness, deadline and sample events
Respond as the monitored system changes.
Use listeners and callback masks to notify your application when entities appear, disappear or publish new statistical information.
- Domain and physical listeners
- Selective callback masks
- Event-driven application updates
Statistics data
Inspect communication from several angles.
Fast DDS publishes measurement families that explain performance, reliability, discovery and delivery behavior. Request raw points or aggregate them over a selected time window.
Latency and throughput
Fast DDS latency, network latency, publication throughput and subscription throughput.
RTPS traffic
Packets and bytes sent or lost, resent DATA, ACKNACK, NACKFRAG and GAP counts.
Discovery
PDP and EDP packets, discovery time, discovered entities and physical information.
Delivery behavior
DATA counts, sample DATA measurements, liveliness, deadline and sample-loss status.
Application API
Ask for the view your workflow requires.
Initialize monitoring for a domain, retrieve its graph and query a specific measurement series. Listener callbacks can update the application as entities or data change.
- Monitor a domain ID or Discovery Server network
- Filter entities by kind and relationship
- Request data by source, target and time interval
auto domain = StatisticsBackend::init_monitor(0);

auto graph =
    StatisticsBackend::get_domain_view_graph(domain);

auto latency = StatisticsBackend::get_data(
    DataKind::FASTDDS_LATENCY,
    writers, readers, 10, t_from, t_to,
StatisticKind::MEDIAN);Choose the observability path
Build the application, or use the complete workspace.
The backend is the right layer when your team needs a custom interface or automation. DDS Monitor Pro is the ready-to-use graphical path for investigation and diagnostics.
Your decision
How much of the experience do you want to build?
Both paths use Fast DDS observability information. The difference is whether your team owns the application layer or starts with eProsima's complete diagnostic workspace.
Capability | Open source Statistics Backend | Commercial DDS Monitor Pro |
|---|---|---|
Primary interface | C++ application API | Graphical workspace |
Application layer | Built by your team | Ready to use |
Topology and statistics | API data model | Interactive views |
Best fit | Custom tools and automation | Engineering investigation |
Developer resources
Start from the library and the data source.
Use the backend documentation for the application API and the Fast DDS documentation to configure the statistics topics published by the monitored system.

Backend documentation
Install the library, initialize monitoring, explore the data types and follow the complete API reference.
Source and examples
Get the Apache 2.0 source code and review complete applications built around the backend API.

Fast DDS Statistics Module
Choose which measurement topics participants publish and configure their recommended DDS behavior.
DDS observability architecture
Need a custom monitoring workflow?
Tell us what the application must detect, calculate or expose. We can help determine whether to build directly on the Statistics Backend or use DDS Monitor Pro.
Required domains, entities and measurements.
Custom dashboards, automation or integrations.
Live and offline investigation needs.
Professional tooling and engineering services.