
DDS Monitor Pro · Sneak preview
Ask your DDS system.
See the answer.
Connect your AI assistant to DDS Monitor Pro. Inspect a running system, create visualisations and put answers to work in the Monitor’s own workspace.
Coming soon to DDS Monitor ProUnderstand your system.
See the evidence.
Exercise your application.
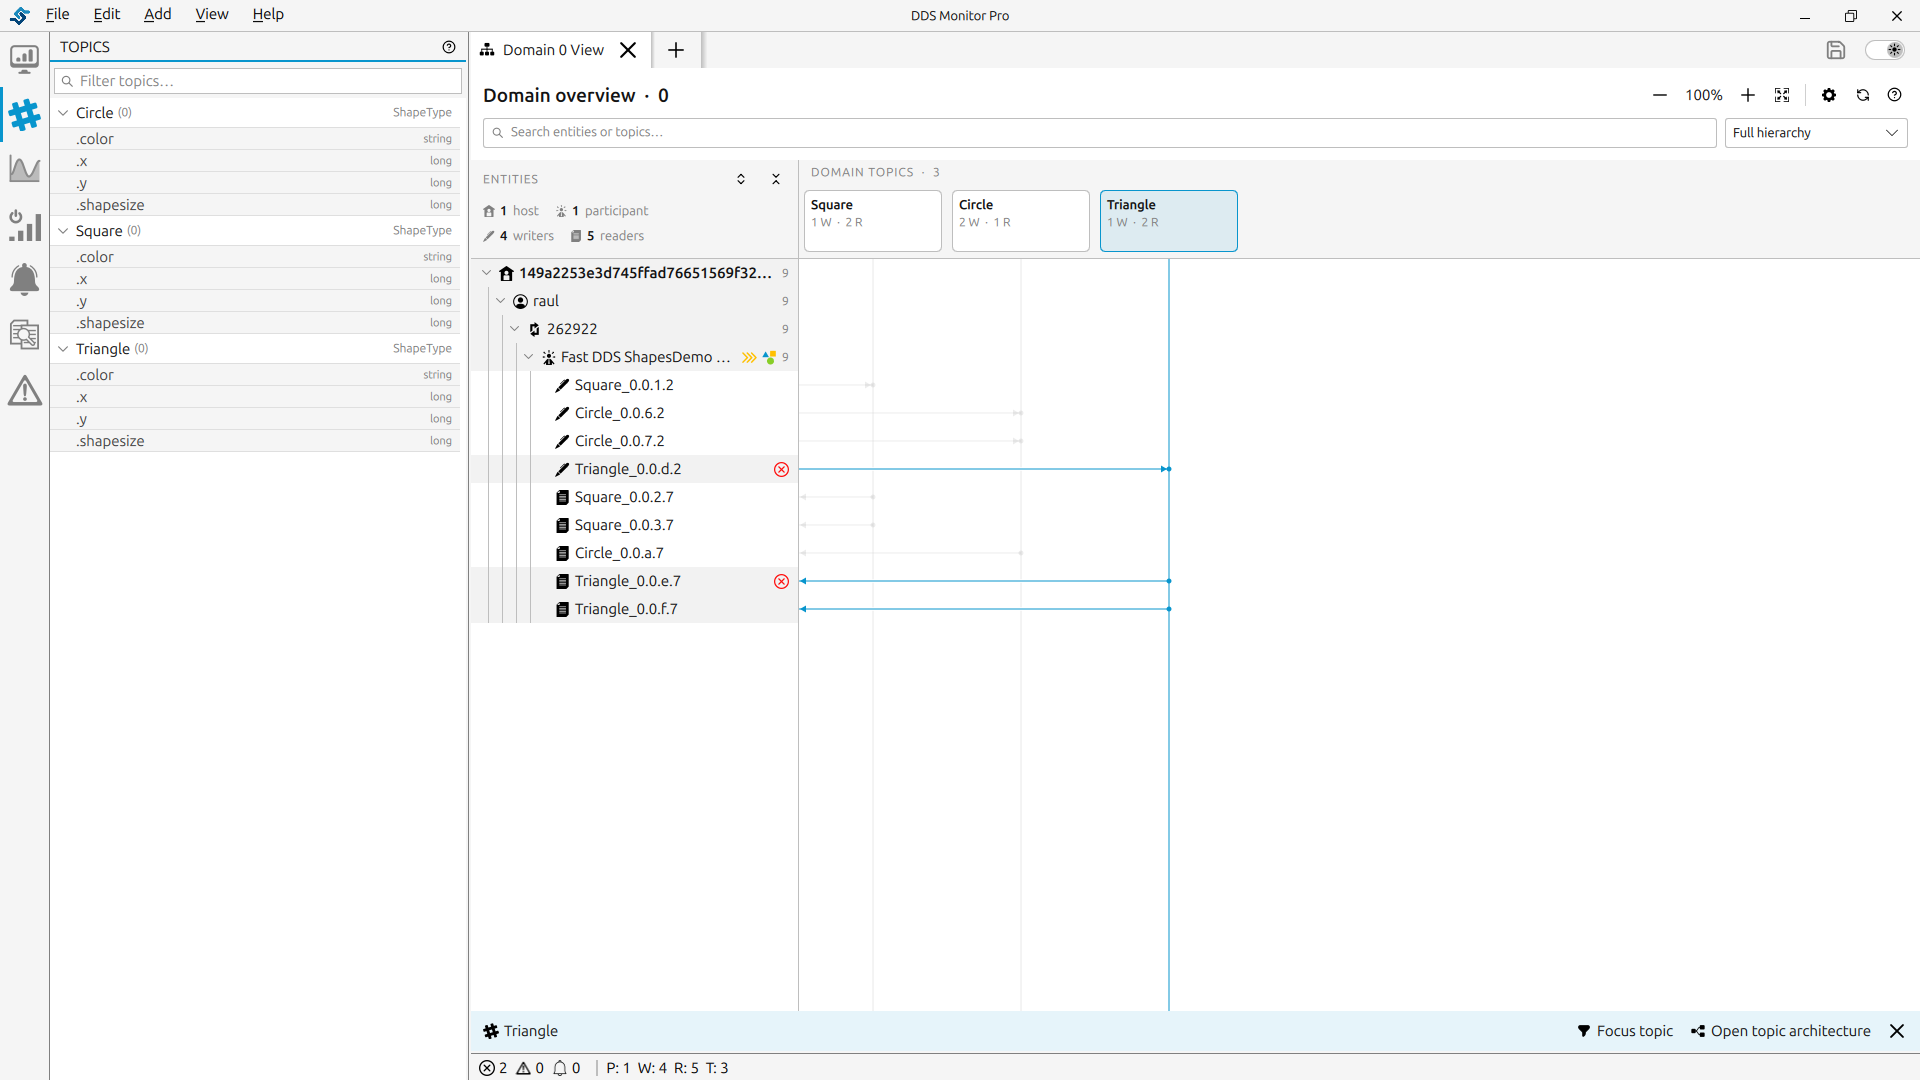
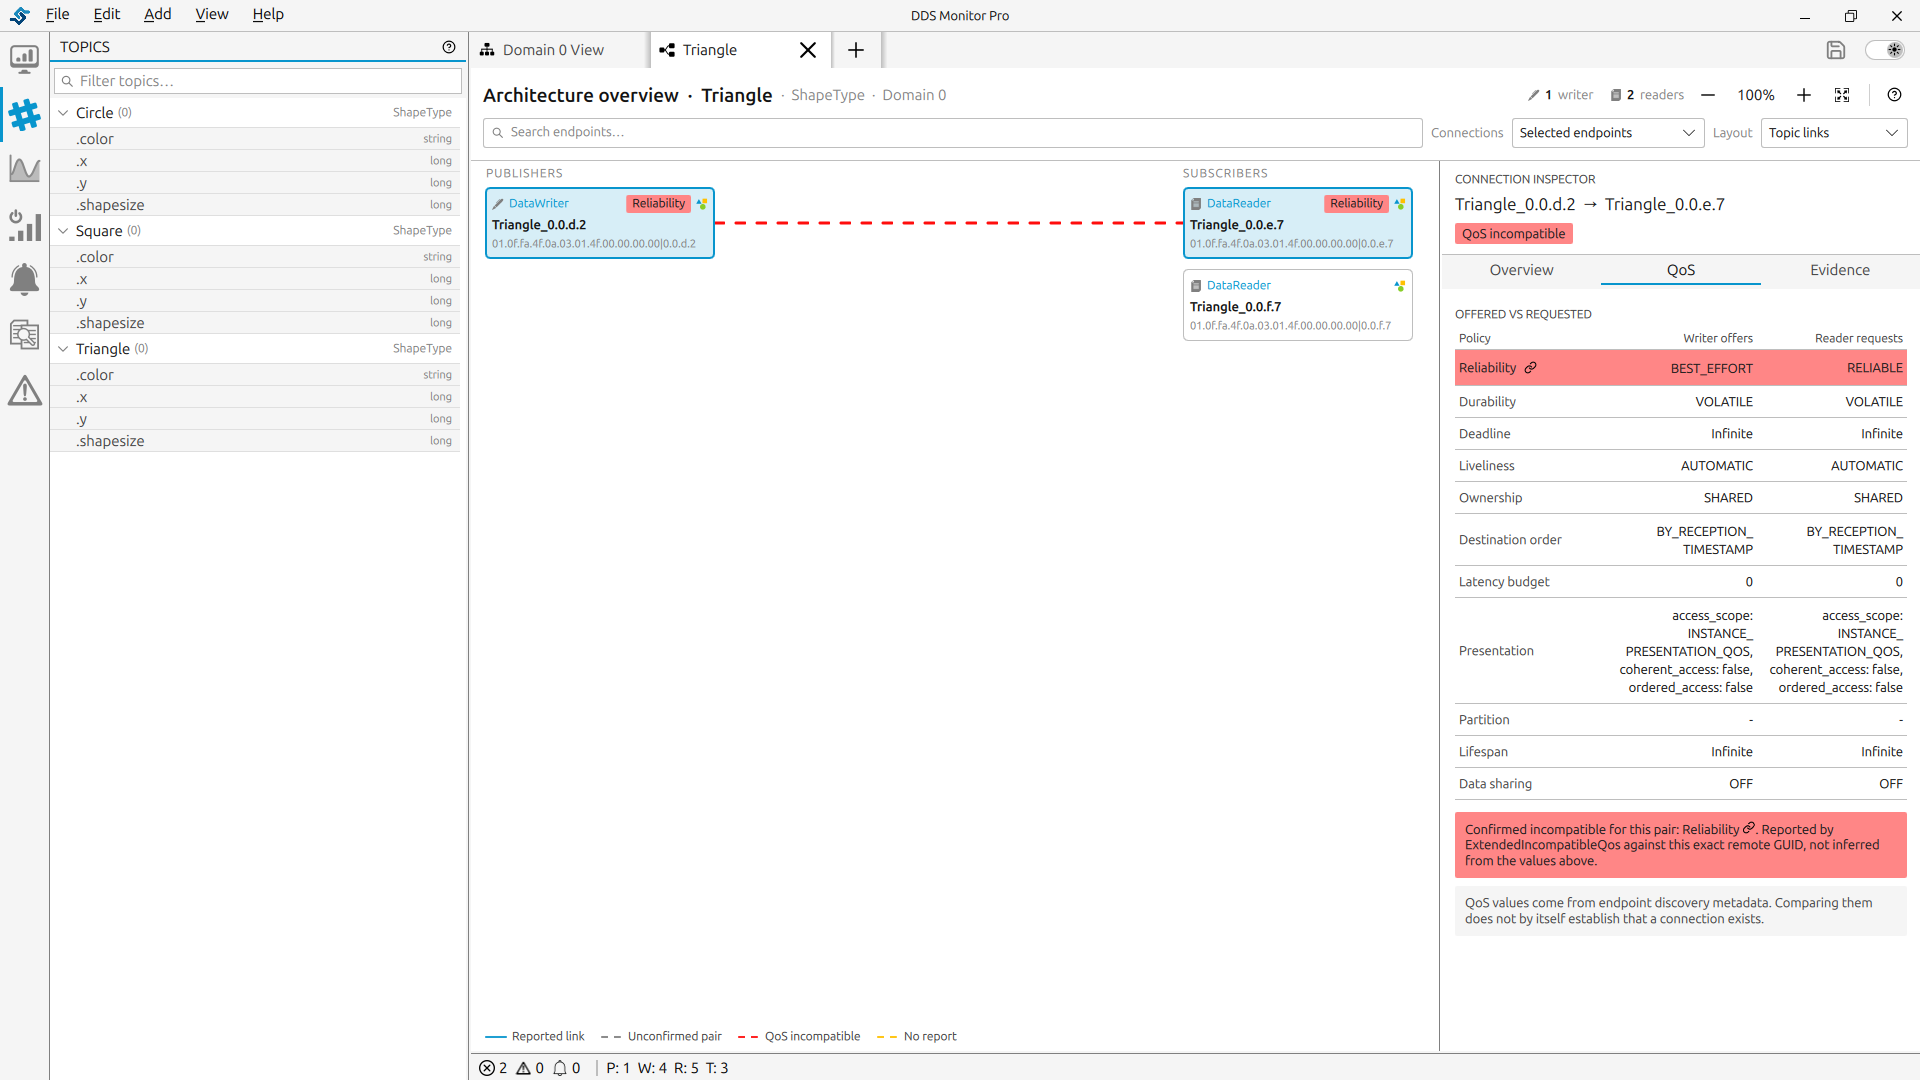
Connected to the demo system.
First look
A new way to work with your DDS system.
The upcoming built-in MCP server connects an AI client to the context and operations already available in DDS Monitor Pro.
Meet the new AI capabilities2:09
Four practical workflows
Ask. Visualise. Test. Diagnose.
Watch the upcoming AI capabilities in action: from understanding a running system to creating charts, publishing test data and investigating communication issues.
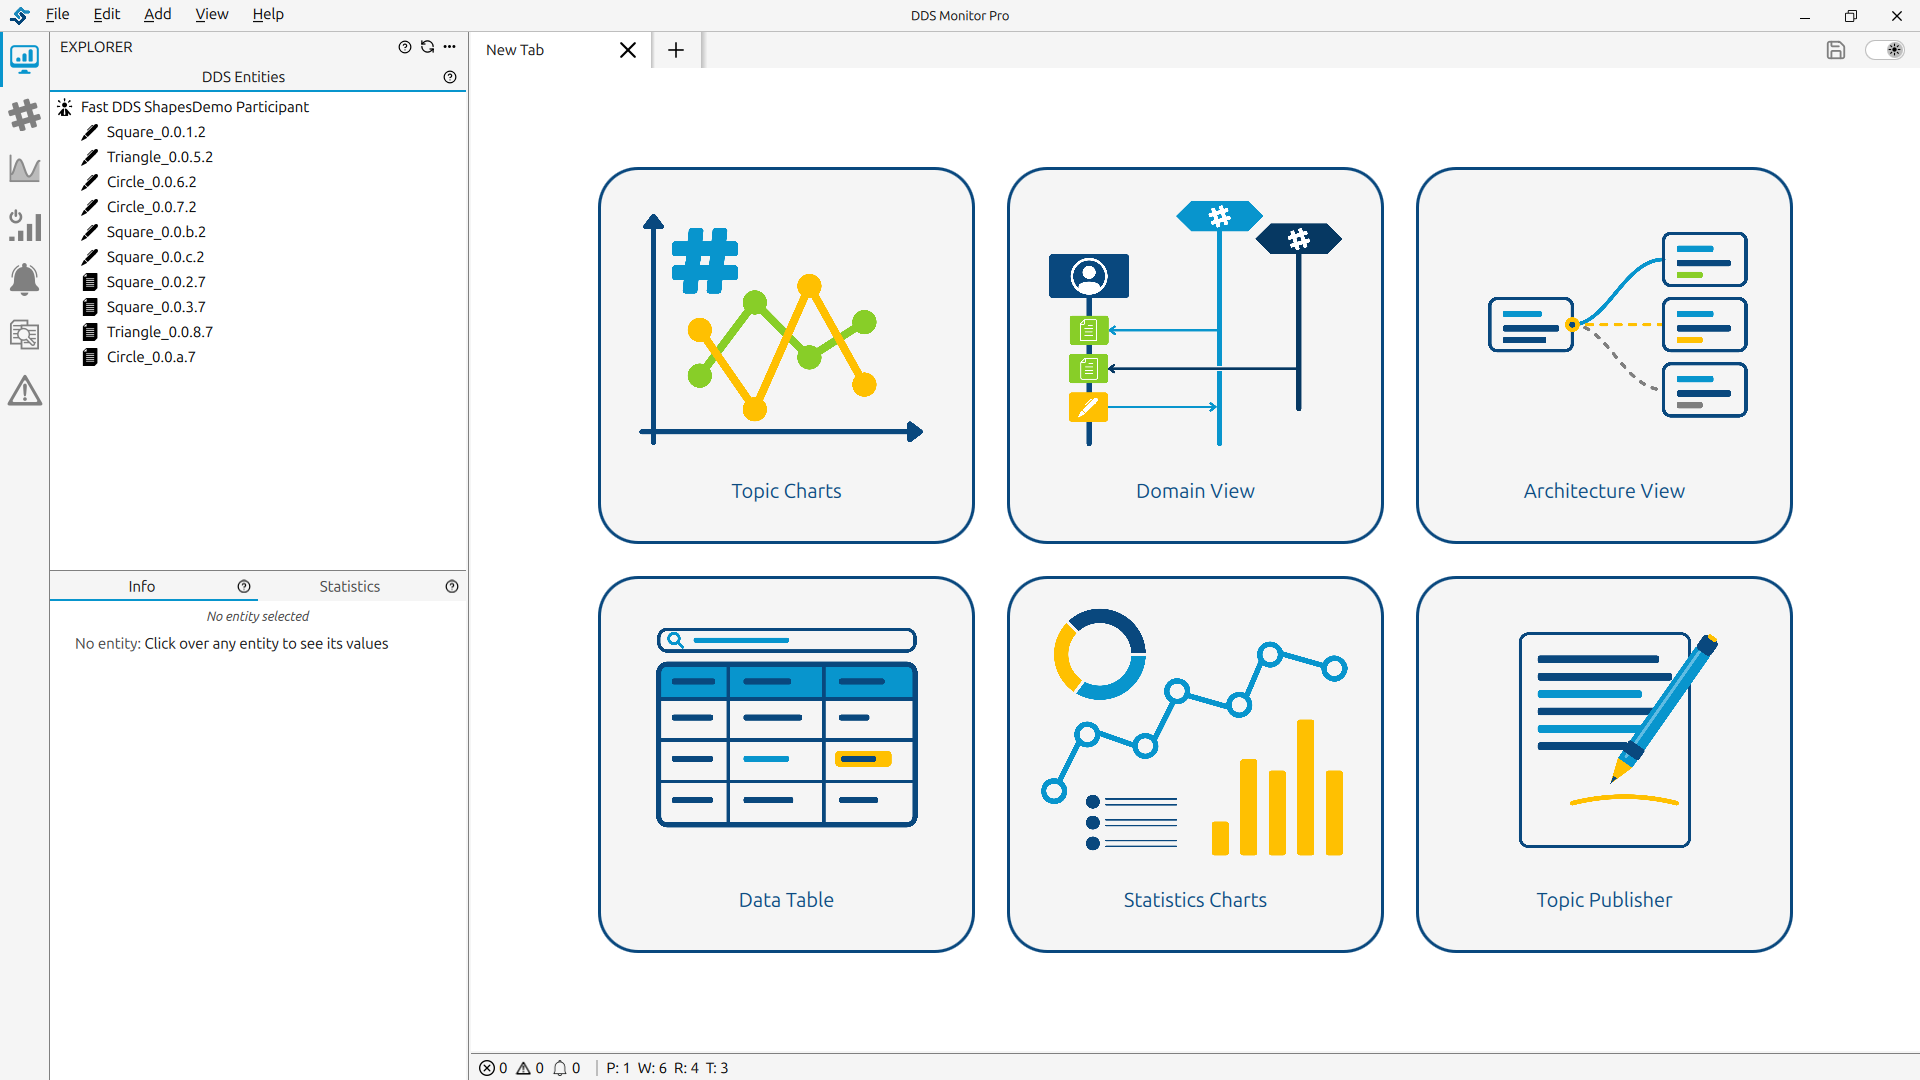
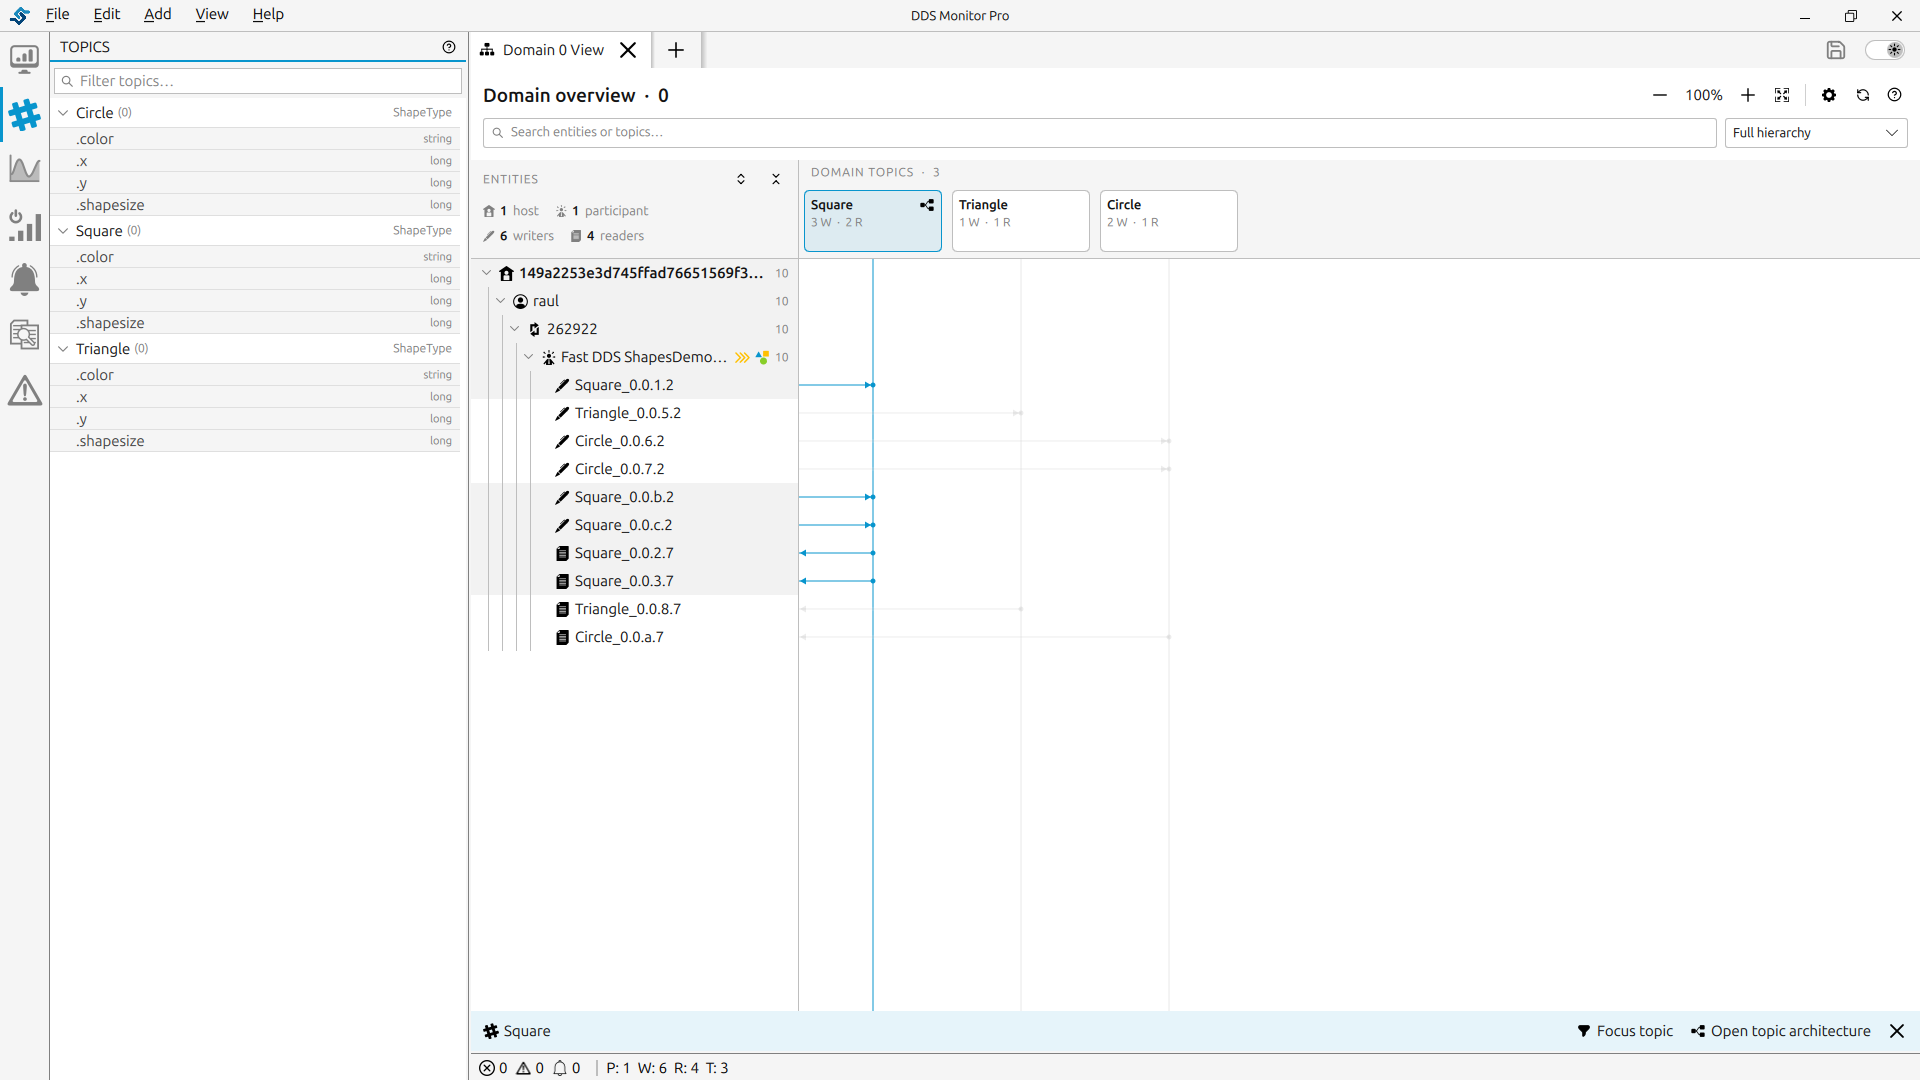
Explore applications and topics, then see the corresponding entities in the Monitor.
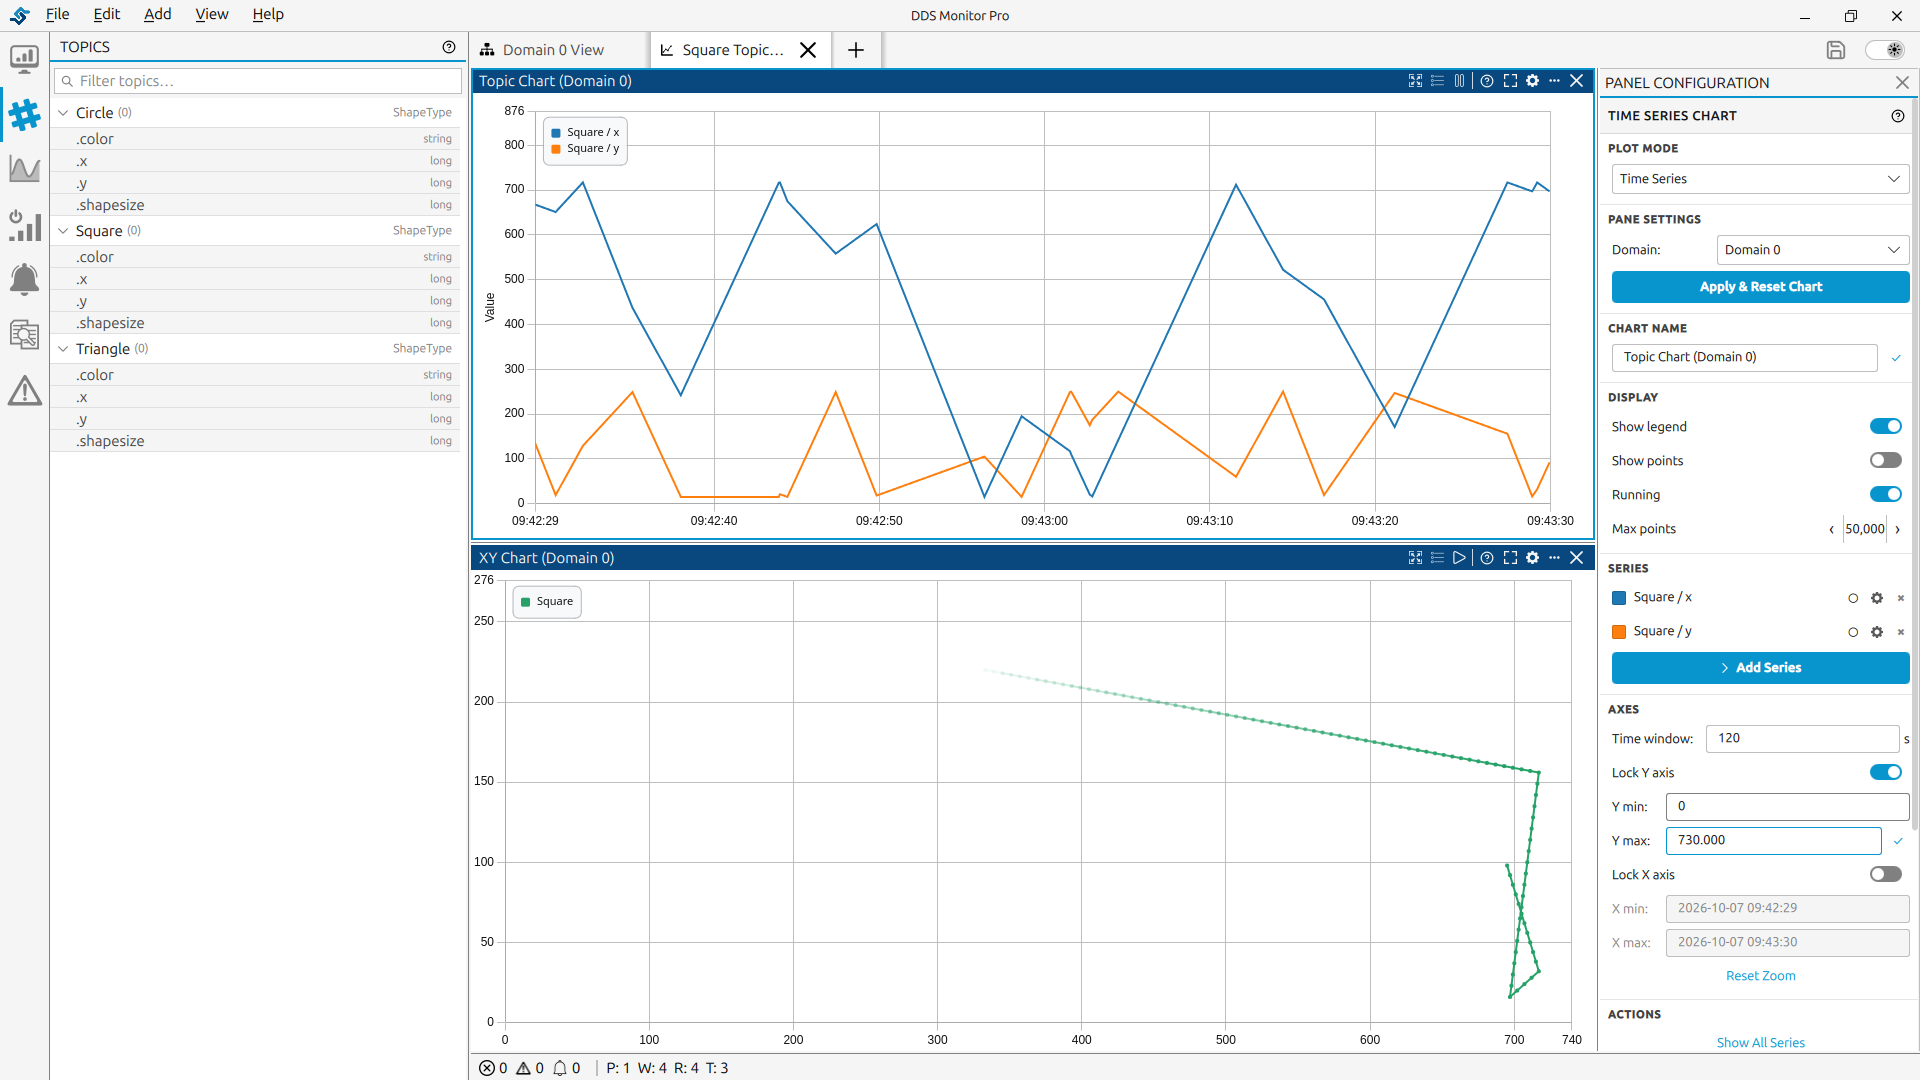
Turn a request into a live chart, with the workspace arranged to show the data clearly.
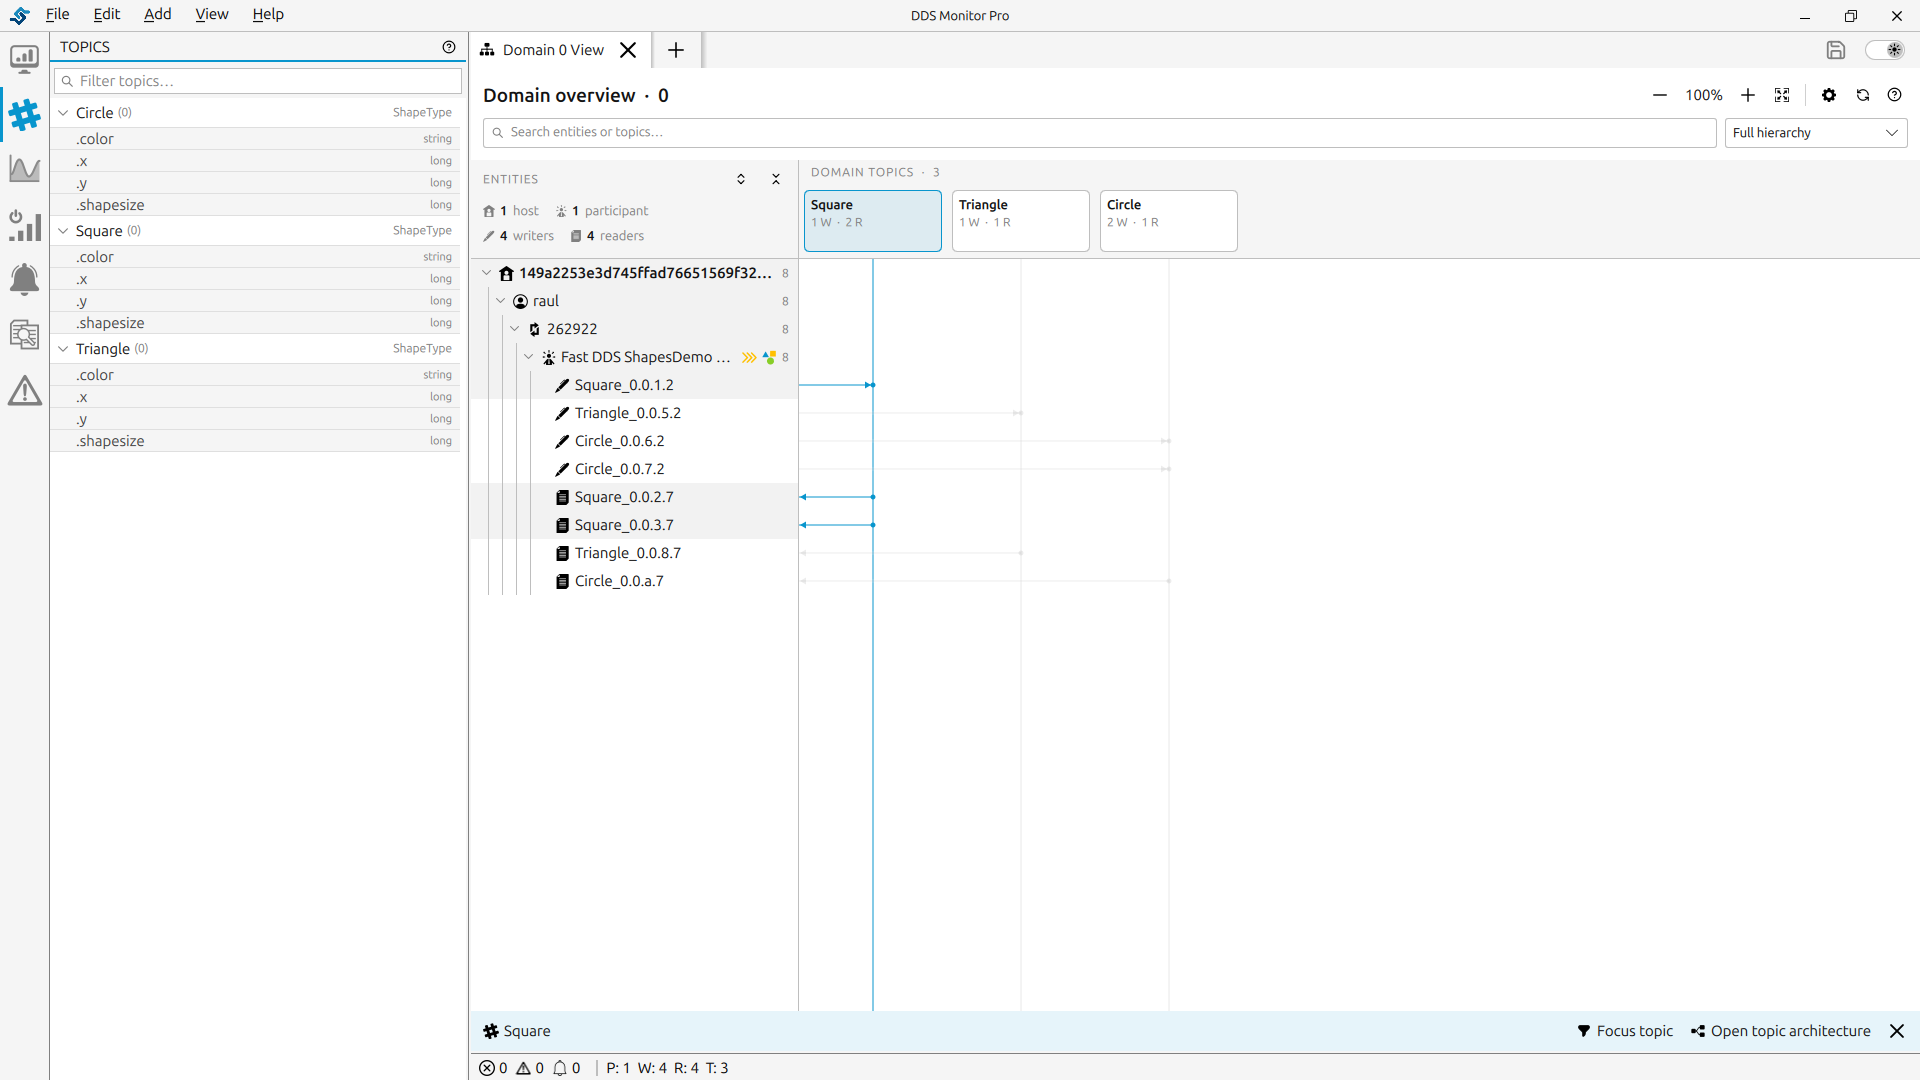
Publish sample data in a test environment and verify reception using the application’s statistics.
Investigate a reliability mismatch and see the incompatible endpoints and QoS settings side by side.
Go deeper
Follow the workflow.
Watch the longer walkthrough to see how the assistant uses system context and Monitor operations together.
Explore the workflow2:26
Built-in MCP server
Your assistant.
Your Monitor. Your system.
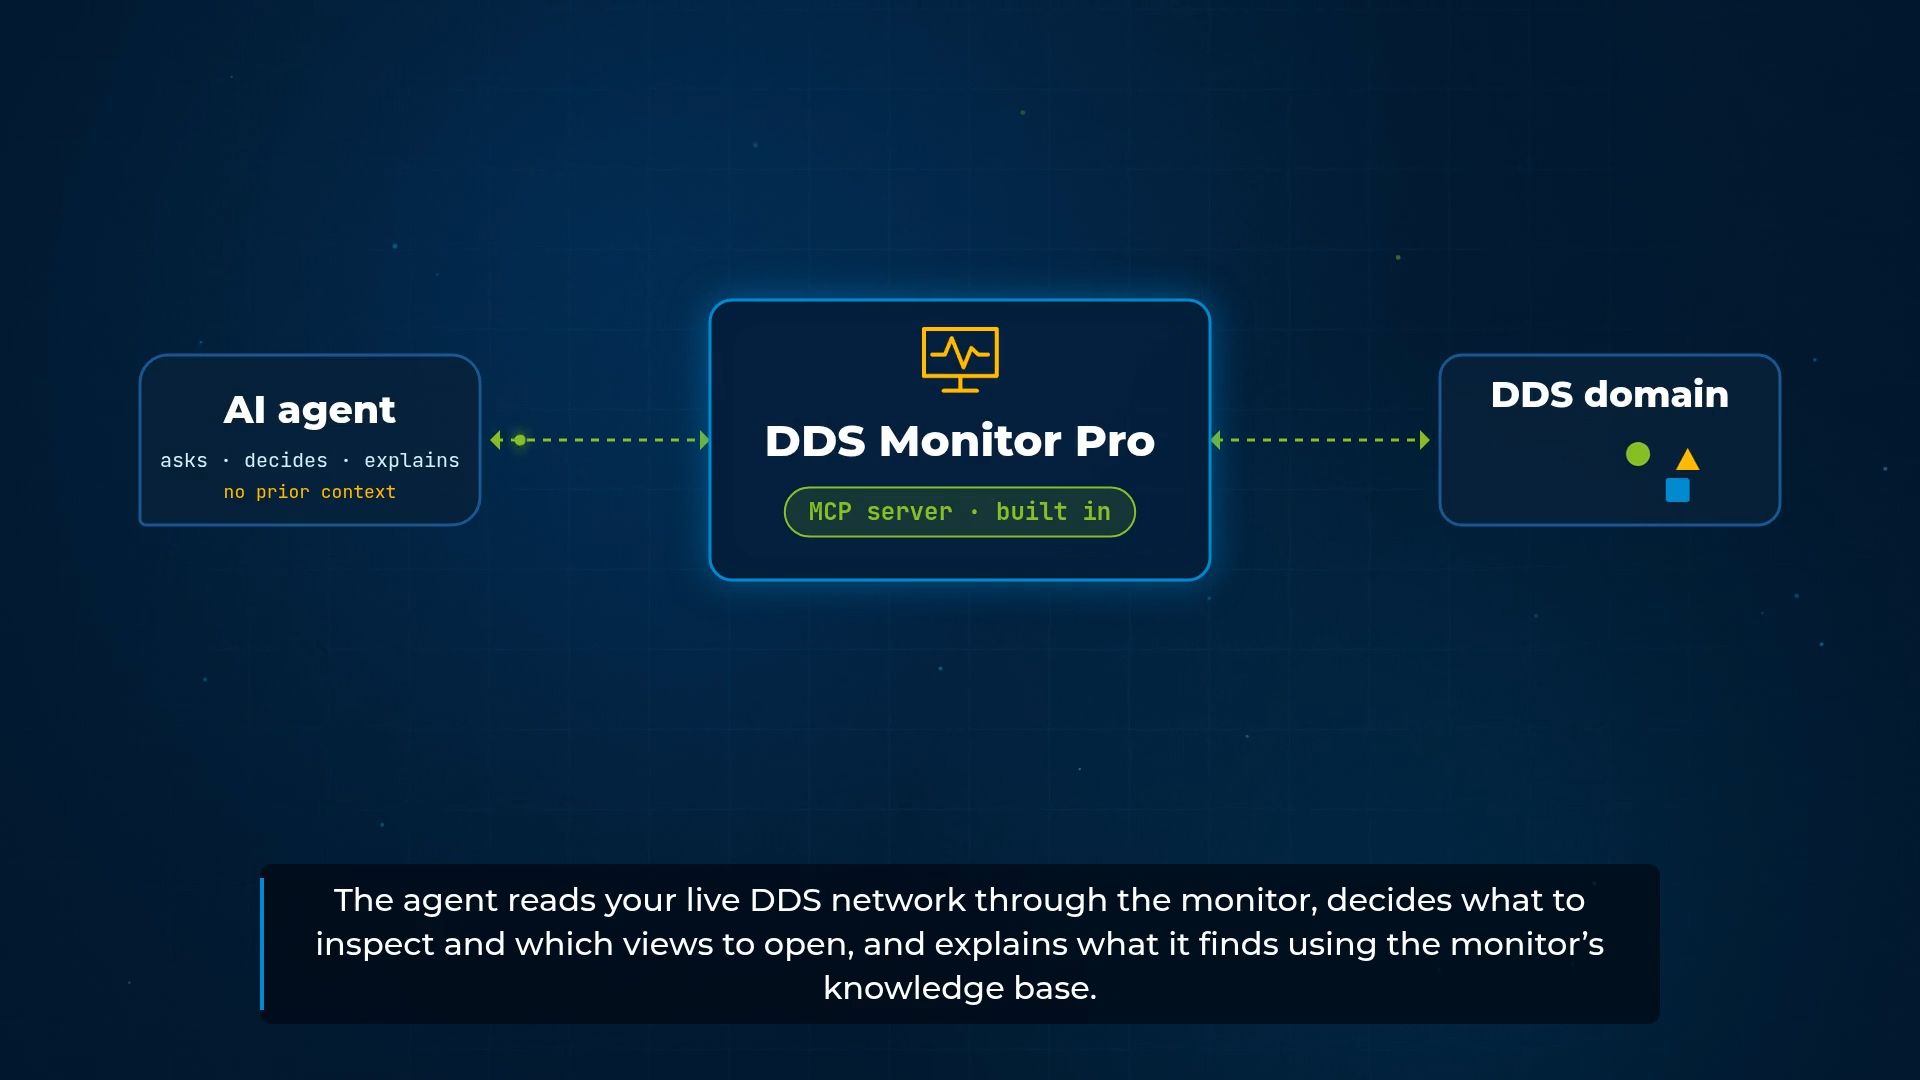
Model Context Protocol (MCP) gives an AI client a defined interface to inspect the system and operate the Monitor.
01 · Ask
AI client
Your MCP-compatible assistant.
02 · Inspect & operate
DDS Monitor Pro
Built-in MCP server, system context and workspace operations.
03 · Observe the result
DDS system
Entities, topics, statistics and test data.
Built into the Monitor.
The Monitor executable connects the local client to the running window; no separate bridge application is required.
Grounded in DDS context.
Entity information, type schemas, topology, statistics and built-in DDS knowledge help the assistant investigate the system.
Control & access
You enable the connection.
The work stays in view.
The AI control panel brings connection management and operation history into the Monitor.
Off at startup
The MCP server starts off each time the Monitor opens. Enable it when you want a local AI client to connect.
Visible activity
Inspect connected clients, disconnect them and review recent operations. New panes and publisher actions remain visible in the workspace.
Validated operations
Plans are checked before execution and against workspace changes. Undo is available for supported workspace changes, not for data already published.
Understand the access you enable.
Enabling MCP grants local clients full access to the Monitor’s supported operations, including publishing data. There is no approval prompt for each operation. Use trusted clients and run publishing experiments in a test environment. Model-provider data handling depends on your AI client configuration.
Talk to a middleware expert
What would you ask your DDS system?
Tell us about your diagnostic, visualisation or testing workflow. Let’s discuss how the upcoming AI capabilities could fit your engineering process.
Coming soon to DDS Monitor Pro.
Preview functionality shown before release.
Release date to be announced.